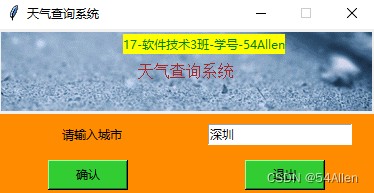
初学Python,制作一个可视化的天气预报系统,完整代码如下,可自行优化界面和其他
下载当地天气预报,应对可能的天气变化。 #生活技巧# #自驾游建议# #自驾旅行路线规划#
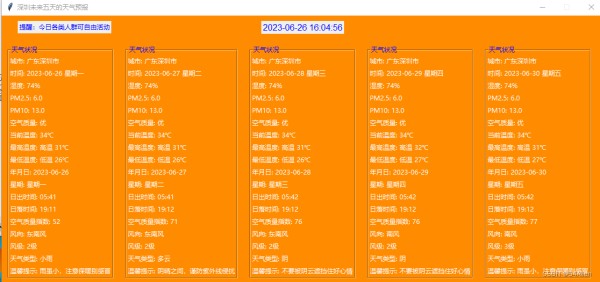
运行结果如下

下面是完整代码,请笑纳!如果觉得该作品还行,请一键3连,谢谢!
from tkinter import *
import requests
import json
from tkinter import messagebox
import datetime
import matplotlib.pyplot as plt
import numpy as np
import warnings
warnings.filterwarnings("ignore")
root = Tk()
def main():
root.title('天气查询系统')
root.configure(bg='DarkOrange')
root.resizable(width=False, height=False)
with open("1.gif", "rb") as file:
image0 = PhotoImage(data=file.read())
Label(root, text='天气查询系统', fg="brown", font=20, compound='center', image=image0).grid(row=0, column=0, columnspan=2, sticky=W + E + N + S)
Label(root, text='请输入城市', bg='DarkOrange').grid(row=1, column=0)
Label(root, text="17-软件技术3班-学号-54Allen", fg="green", bg="yellow").place(x=125, y=5, width=162, height=20)
enter = Entry(root)
enter.grid(row=1, column=1, padx=10, pady=10)
enter.delete(0, END)
enter.insert(0, '深圳')
running = 1
def getCityCode(city):
url = 'http://toy1.weather.com.cn/search?cityname=' + city
try:
r = requests.get(url, timeout=1)
r.raise_for_status()
if len(r.text) > 4:
json_arr = json.loads(r.text[1:len(r.text) - 1])
code = json_arr[0]['ref'][0:9]
return code
except (requests.HTTPError, json.JSONDecodeError, requests.RequestException):
messagebox.showerror("错误", "获取城市代码超时,请检查URL是否有效")
return "000000000"
def get_weather_data():
city = enter.get()
code = getCityCode(city)
url = 'http://t.weather.sojson.com/api/weather/city/' + code
r = requests.get(url, timeout=1)
try:
r.raise_for_status()
info = r.json()
formatted_data = json.dumps(info, indent=4)
print(formatted_data)
if info['status'] == 200:
weather_data = []
weather = {}
forecast_data = info['data']['forecast']
for forecast in forecast_data:
weather = {}
weather['城市:'] = info['cityInfo']['city']
weather['时间:'] = forecast['ymd'] + ' ' + forecast['week']
weather['湿度:'] = info['data']['shidu']
weather['PM2.5:'] = info['data']['pm25']
weather['PM10:'] = info['data']['pm10']
weather['空气质量:'] = info['data']['quality']
weather['温度:'] = info['data']['wendu']
weather['感冒指数:'] = info['data']['ganmao']
weather['日期:'] = forecast['date']
weather['最高温度:'] = forecast['high']
weather['最低温度:'] = forecast['low']
weather['年月日:'] = forecast['ymd']
weather['星期:'] = forecast['week']
weather['日出时间:'] = forecast['sunrise']
weather['日落时间:'] = forecast['sunset']
weather['空气质量指数::'] = forecast['aqi']
weather['风向:'] = forecast['fx']
weather['风级:'] = forecast['fl']
weather['天气类型:'] = forecast['type']
weather['温馨提示:'] = forecast['notice']
weather_data.append(weather)
return weather_data
else:
messagebox.showerror("错误", '[' + city + ']不存在!')
except requests.Timeout:
messagebox.showerror("错误", "服务器请求繁忙,请稍后再试!")
except (requests.HTTPError, json.JSONDecodeError) as e:
messagebox.showerror("错误", str(e))
def update_current_time(label):
current_time = datetime.datetime.now().strftime("%Y-%m-%d %H:%M:%S")
label.config(text=current_time)
label.after(1000, update_current_time, label)
def show_data(weather_data, city):
root1 = Toplevel()
root1.geometry('1120x500')
root1.resizable(width=False, height=False)
root1.title(city + '未来五天的天气预报')
root1.configure(bg='DarkOrange')
current_time_label = Label(root1, font=('Arial', 12), fg='blue')
current_time_label.pack(pady=10)
update_current_time(current_time_label)
for weather in weather_data:
LANGS = [
(str(weather['城市:']), '城市'),
(str(weather['时间:']), '时间'),
(str(weather['湿度:']), '湿度'),
(str(weather['PM2.5:']), 'PM2.5'),
(str(weather['PM10:']), 'PM10'),
(str(weather['空气质量:']), '空气质量'),
(str(weather['温度:']+'℃'), '当前温度'),
(str(weather['最高温度:']), '最高温度'),
(str(weather['最低温度:']), '最低温度'),
(str(weather['年月日:']), '年月日'),
(weather['星期:'], '星期'),
(str(weather['日出时间:']), '日出时间'),
(str(weather['日落时间:']), '日落时间'),
(str(weather['空气质量指数::']), '空气质量指数'),
(weather['风向:'], '风向'),
(str(weather['风级:']), '风级'),
(weather['天气类型:'], '天气类型'),
(weather['温馨提示:'], '温馨提示')
]
group = LabelFrame(root1, text='天气状况', padx=0, pady=0, fg="blue", bg='DarkOrange')
group.pack(padx=11, pady=0, side=LEFT)
for lang, value in LANGS:
c = Label(group, text=value + ': ' + lang, bg='DarkOrange', fg='white')
c.pack(anchor=W)
Label(root1, text='提醒:今日' + weather['感冒指数:'], fg='blue').place(x=30, y=10)
dates = [weather['年月日:'] for weather in weather_data]
high_temps = [int(weather['最高温度:'].split(' ')[1].split('℃')[0]) for weather in weather_data]
low_temps = [int(weather['最低温度:'].split(' ')[1].split('℃')[0]) for weather in weather_data]
plt.figure(figsize=(16, 4))
plt.plot(dates, high_temps, marker='o', label='最高温度')
plt.plot(dates, low_temps, marker='o', label='最低温度')
plt.xlabel('日期')
plt.ylabel('温度(℃)')
plt.title('未来15天气温趋势图')
plt.legend()
plt.grid(True)
plt.xticks(rotation=45, ha='right')
plt.tight_layout()
plt.rcParams['font.sans-serif'] = ['SimSun']
plt.rcParams['axes.unicode_minus'] = False
for date, high_temp, low_temp in zip(dates, high_temps, low_temps):
plt.text(date, high_temp, str(high_temp) + "℃", ha='center', va='bottom')
plt.text(date, low_temp, str(low_temp) + "℃", ha='center', va='top')
plt.show()
root1.mainloop()
def button_click():
city = enter.get()
button1.config(state=DISABLED)
show_data(get_weather_data(), city)
def destroy_windows():
root.destroy()
plt.close()
button1 = Button(root, text="确认", width=10, command=button_click, bg='LimeGreen')
button1.grid(row=4, column=0, sticky=W, padx=50, pady=5)
button2 = Button(root, text='退出', width=10, command=destroy_windows, bg='LimeGreen')
button2.grid(row=4, column=1, sticky=E, padx=50, pady=5)
if running == 1:
root.mainloop()
if __name__ == '__main__':
main()
网址:初学Python,制作一个可视化的天气预报系统,完整代码如下,可自行优化界面和其他 https://www.yuejiaxmz.com/news/view/571464
相关内容
【关注可白嫖源码】基于python的个性化电影推荐系统基于Python爬虫吉林长春天气预报数据可视化系统设计与实现(Django框架) 研究背景与意义、国内外研究现状
Python爬虫山东济南景点数据可视化和景点推荐系统 开题报告
python基础===Python 代码优化常见技巧
使用Python在Raspberry Pi上构建家庭自动化系统
python基于天气预测的生活规划系统的设计与实现
Python智能推荐系统与个性化电商
python可以不对变量初始化
5 个自动化生活的 Python 项目:从初学者到高级
从初级到高级,5个可以用到生活中的Python自动化项目
随便看看
最新动态分享
- DIY卫生间装修零基础教程10大避坑指南与省钱攻略,手把手教你打造高性价比卫生间
- 洗手间DIY装修全攻略:零基础小白也能轻松完成,省下万元预算
- DIY卫生间装修全攻略:5步搞定实用又高颜值浴室,附避坑指南(附材料清单)
- ️厕所装修避坑指南零基础手把手教你DIY省下2W!附水电改造防水防滑全攻略
- 厨房和洗手间如何装修diy
- 浴室干湿分离+养生三件套=健康生活新标配!亲测有效的5大设计法则
- 客厅玩具区装修全攻略:儿童房DIY设计技巧与收纳方案(附预算清单)
- 最火的设计!儿童房涂鸦墙DIY全攻略:零基础也能打造高颜值艺术角?附避坑指南
- 儿童房全屋定制效果图大全
- 客厅背景墙设计新趋势|卧室儿童房壁画DIY指南|低成本打造高颜值家居
热点动态分享
- 138519
- 40879
- 36491
- 25641
- 24767
- 23855
- 21585
- 16472
- 15078
- 15040