python数据处理第十一天
数据分析:Python的Pandas库数据处理 #生活知识# #编程教程#
import plotly.express as px
import json
filename='D:\matplotlib\eq_data_1_day_m1 (1).json'
with open(filename) as f:
all_eq_data=json.load(f)
all_eq_dicts = all_eq_data['features']
mags,titles,lons,lats = [],[],[],[]
for eq_dict in all_eq_dicts:
mag = eq_dict['properties']['mag']
title = eq_dict['properties']['title']
lon = eq_dict['geometry']['coordinates'][0]
lat = eq_dict['geometry']['coordinates'][1]
mags.append(mag)
titles.append(title)
lons.append(lon)
lats.append(lat)
fig = px.scatter(
x=lons,
y=lats,
labels={'x':'Jingdu','y':'Weidu'},
range_x=[-200,200],
range_y=[-90,90],
width=800,
height=800,
title='Sandiantu'
)
fig.write_html('global_earthquakes.html')
fig.show()
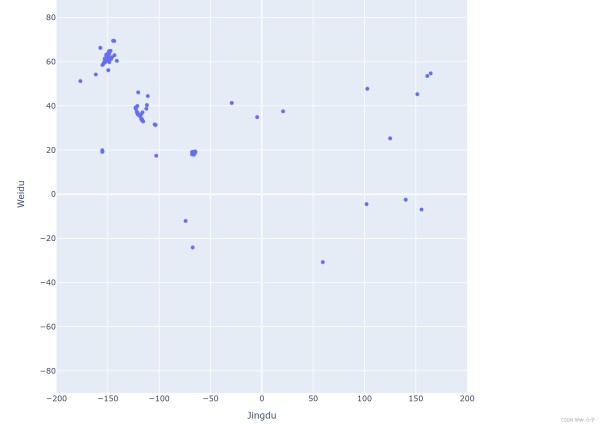
这里绘制散点图如下:
这里注意需要下载pandas才可以运行,
在国内下载pandas可用
pip install pandas -i https://pypi.tuna.tsinghua.edu.cn/simple
可用快速下载
也可以直接导入变量:
import plotly.express as px
from equ_explore_data import lons,lats
fig = px.scatter(
x=lons,
y=lats,
labels={'x':'Jingdu','y':'Weidu'},
range_x=[-200,200],
range_y=[-90,90],
width=800,
height=800,
title='Sandiantu'
)
fig.write_html('global_earthquakes.html')
fig.show()
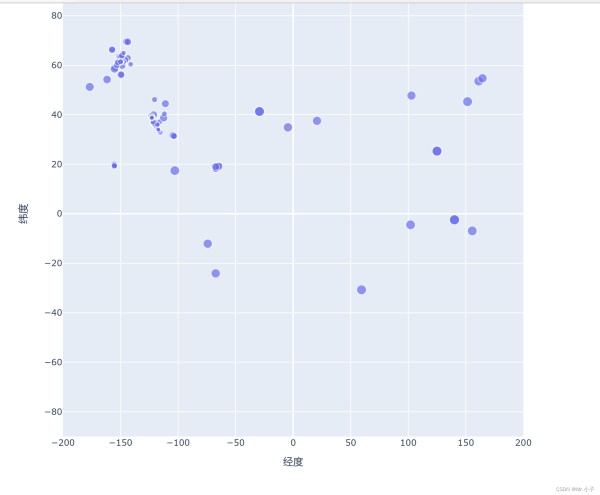
显示震级:
import plotly.express as px
from equ_explore_data import lons,lats,mags
fig = px.scatter(
x=lons,
y=lats,
labels={'x':'经度','y':'纬度'},
range_x=[-200,200],
range_y=[-90,90],
width=800,
height=800,
title='全球地震散点图',
size=mags,
size_max=10,
)
fig.write_html('global_earthquakes.html')
fig.show()
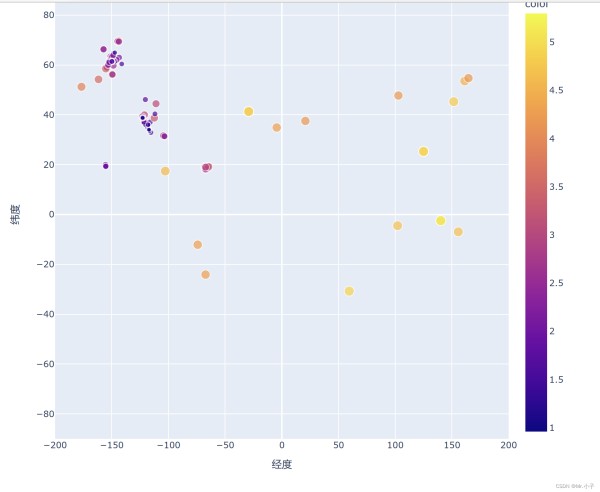
效果图:
import plotly.express as px
from equ_explore_data import lons,lats,mags
fig = px.scatter(
x=lons,
y=lats,
labels={'x':'经度','y':'纬度'},
range_x=[-200,200],
range_y=[-90,90],
width=800,
height=800,
title='全球地震散点图',
size=mags,
size_max=10,
color=mags,
)
fig.write_html('global_earthquakes.html')
fig.show()
效果为:
网址:python数据处理第十一天 https://www.yuejiaxmz.com/news/view/296109
相关内容
机器学习之数据预处理(Python 实现)Python数据分析实战
(Python)组合数据:Python中的列表、元组、集合
数据挖掘:数据清洗——数据噪声处理
python数据分析
python数据结构练习
python excel数据分析师职业技能
Python数据分析:对饮食与健康数据的分析与可视化
【Python】Python连接Hadoop数据中遇到的各种坑(汇总)
python查询数据库返回字典
随便看看
最新动态分享
- 适合搭配的食材
- 食疗养生大全:67种天然食材搭配与食疗方,吃出健康好气色
- 哪些食材可以搭配食用 十对最佳食材搭配好吃又健康
- 壮阳补肾煲汤大全:中药配方与食材搭配全解析
- 广东鱼肚汤的家常做法大全|营养功效+食材搭配+5种经典汤谱(附详细步骤)
- 四季美容养颜豆浆配方大全|天然食材搭配+科学原理,喝出透亮肌
- 零失败家常小炒菜谱大全(附新手必学技巧+食材搭配指南)
- 补肾食谱大全:10种家常食疗方+食材清单,科学搭配提升肾动力
- 5种营养搭配!家常鸡汤快手做法大全(附不同做法+食材禁忌)
- 麻辣香锅食材菜单大全图
热点动态分享
- 144425
- 46530
- 44473
- 40159
- 39049
- 30197
- 24908
- 24683
- 21200
- 18106